Blog
3 Treasury Metrics Every Team Should Track (and How to Automate Them)
Written by Jason Mountford
May 6th, 2025
Finding the best treasury metrics and KPIs to monitor can sometimes feel like more art than science. Every company will have different plans to drive growth, and individuals will have their own experience and opinions on what should be tracked to support these plans.
With that said, there are some core metrics across different parts of the finance function that should be considered non-negotiables. In this article, we’re kicking off a new series on must-track KPIs and metrics for a range of roles across finance and treasury. In each installment, we’ll unpack essential metrics for accountants, analysts, CFOs and, today, treasurers.
But deciding on what the key metrics are doesn’t mean it’s problem solved.
The need for accurate, up-to-date metrics is clear, but pulling those insights from a tangle of spreadsheets, portals, and static systems? That’s the real drain. Modern treasury software changes that equation. So, not only will we look at some of the most important metrics you should keep track of, but also how you can track them automatically with Trovata.
Daily Cash Position: The Foundational Treasury Metric You Should Automate
Your daily cash position tells you how much cash is available across your organization at the start of each business day. Treasurers often need to view this metric by legal entity, bank, geographic region, and currency.
This provides a clear picture of where funds are concentrated, where liquidity is needed, and where excess capital might be better utilized.
Why it Matters
Knowing your daily cash position is table stakes for treasurers. Without it, you risk making decisions in the dark. A clear view into daily liquidity enables more accurate funding strategies, reduces reliance on reactive cash movements, and helps mitigate risk in volatile market environments.
For companies scaling rapidly or operating across regions, this visibility is essential to avoid missed opportunities or cash shortfalls.
How to Calculate Daily Cash Position Manually
Log into each bank portal and download balance reports
Convert foreign currency balances if needed
Map each account to its entity, region, or business line
Consolidate balances in a spreadsheet
Reconcile discrepancies or missing data
Sure, this can be reasonably accurate if done regularly. However, calculating daily cash position manually will not provide real-time data, is likely to take 1–2 hours daily (at best), and leaves you wide open for user calculation errors.
How to Calculate Daily Cash Position with Trovata
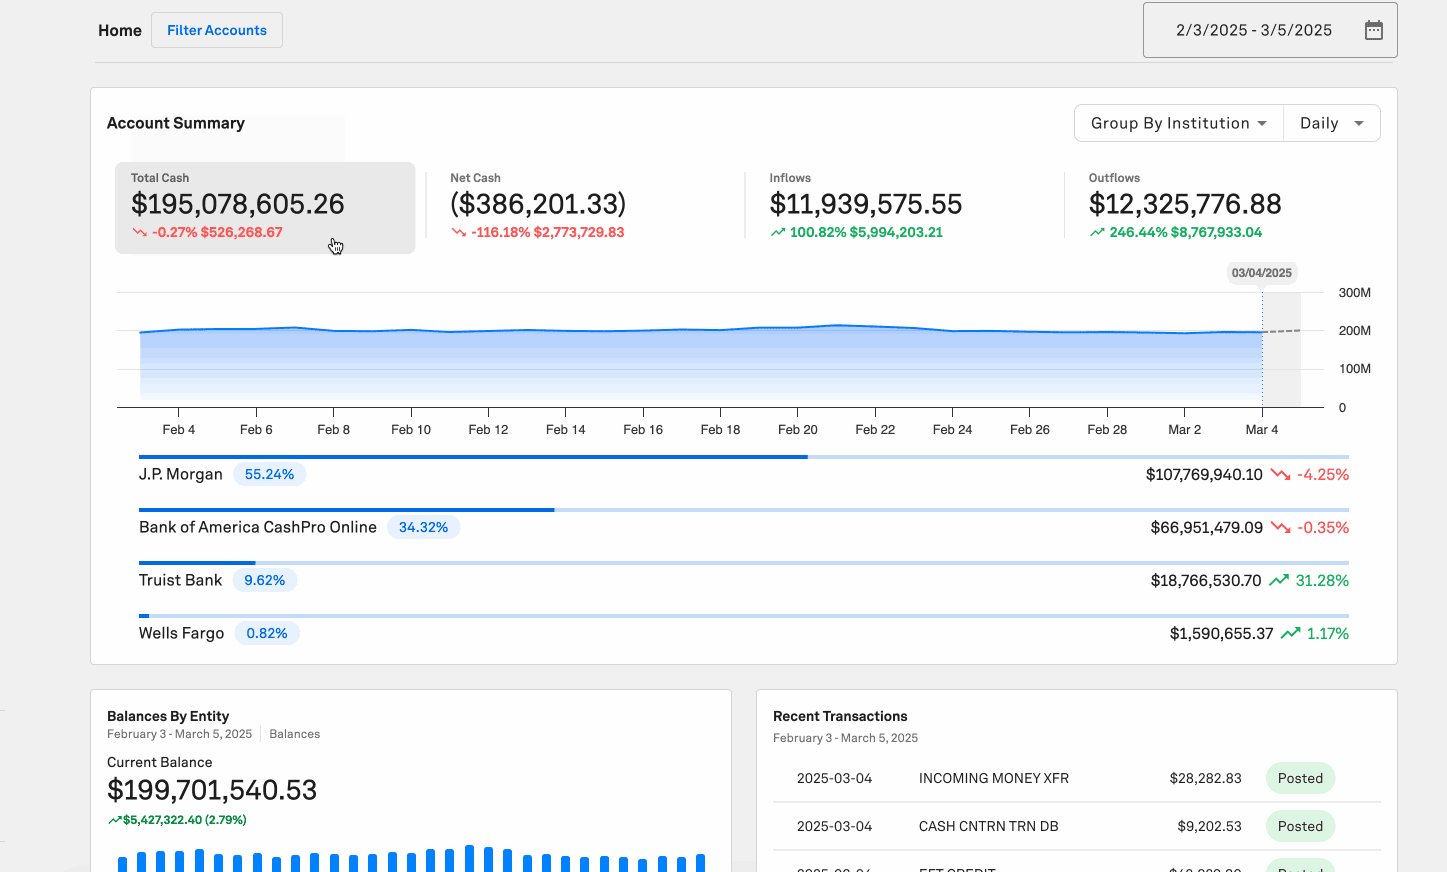
Trovata gives you all of this information at your fingertips, removing the need for manual data consolidation and normalization. To view and analyze your daily cash position, you can:
Open Trovata’s Home Page for an instant view of your consolidated cash position or go to the Cash Position module
Filter balances by entity, bank, or region
Save custom dashboards for one-click access
Export or share with stakeholders instantly
2. Cash Flow Forecast vs. Actuals vs. Budget
Where you’re going, where you want to be, and where you actually are. Those are the three big questions that treasurers need to be able to answer when it comes to their financials. This metric aims to do just that by comparing three views of your expected cash position:
Budget - What you planned at the start of the fiscal year (where you want to be)
Forecast - Your updated view based on actuals and recent trend (where you’re going)
Actuals - What actually happened (where you are)
Monitoring the gaps between these three tells you how accurate your planning process is and whether course correction is needed.
Why it Matters
It’s one thing to create a forecast, but it’s another to ensure it holds up in reality. This metric helps treasurers uncover planning blind spots, build accountability across the organization, and establish a tighter feedback loop between strategy and execution.
Variance analysis between forecast, budget, and actuals helps highlight risks before they become issues and creates a foundation for more reliable, rolling forecasts.
How to Calculate Forecast vs Actuals vs Budget Manually
Maintain a spreadsheet model for budget and forecast
Pull actual cash flow data manually from bank portals or ERP
Match actuals to forecast and budget line items
Calculate variance and summarize
Gathering this data and forecasting manually comes with some significant challenges. It’s time-consuming and error-prone, difficult to keep updated and throws up some real tangible problems with version control when collaborating with others in the team.
How to Calculate it with Trovata
Just like with the daily cash position, there’s no need to spend hours gathering data for forecasts vs budget vs actuals because all of that information is fed automatically into Trovata, in real-time, using open banking APIs or legacy data transfers. This means treasurers can:
Create custom dashboards to allow you to see forecast vs actuals vs budget instantly, all pulled from real-time data
Have the ability to create customized rolling forecasts on any metric or segment by tagging historical cash flows
Compare forecast to actuals using Trovata’s variance analysis tools
Filter by region, business line, or category
3. Net Cash Flow Over Time
Net cash flow measures the difference between cash inflows and cash outflows over a specific period. It provides a direct view into whether your company is building cash reserves or drawing them down.
Rather than focusing on isolated periods, tracking net cash flow trends over time allows treasurers to monitor the long-term trajectory of liquidity health across the business.
Why it Matters
Net cash flow is one of the most telling indicators of an organization’s financial resilience. Positive net cash flow signals strength, giving you resources to invest, expand, or weather uncertainty.
Negative cash flow isn't always a red flag (many companies plan for temporary drawdowns during periods of heavy investment), but without real-time tracking, it's easy for temporary trends to become chronic issues.
Monitoring net cash flow regularly ensures treasurers can spot concerning patterns early, communicate cash strategy to leadership with confidence, and support better capital allocation decisions.
How to Calculate Net Cash Flow Over Time Manually
Consolidate all cash inflows (customer payments, investment returns, asset sales) over a reporting period
Consolidate all cash outflows (payroll, vendor payments, capital expenditures, debt servicing) over the same period
Subtract total outflows from total inflows
Repeat for each period to assess trends over time
Doing this manually requires meticulous reconciliation across banking portals, ERP systems, and operational reports. Month-end or quarter-end timing differences can also make manual tracking messy without a strong centralized system.
How to Calculate Net Cash Flow Over Time with Trovata
Trovata aggregates cash inflows and outflows automatically across your global bank accounts, giving treasurers real-time visibility into net cash flow. Using Trovata, you can:
Instantly view net cash flow over custom time periods (weekly, monthly, quarterly)
Break down inflows and outflows by entity, region, or category for deeper analysis
Use historical trends to support cash flow forecasting and liquidity planning
What Gets Measured (Easier) Gets Managed (Better)
These aren’t vanity metrics. They’re foundational KPIs that treasury teams rely on every day. With Trovata, the manual work is replaced by real-time dashboards, flexible tagging, and seamless reporting.
“We’re in Trovata every day. We couldn’t do without it. If we had to manage 100 bank accounts manually, it wouldn’t be possible. - Megan McLaughlan, Treasury Manager at Park Place Technologies
With less time spent on working out exactly what is happening, treasurers can focus on the strategic question of how to navigate it.
Want to see what’s possible with your own data? Book a demo with Trovata and take the grunt work out of treasury reporting.

Jason Mountford
A finance professional with over 15 years in wealth management, Jason started Hedge, a content agency, to bridge the gap between great writers and great finance businesses. He is a fully qualified Financial Advisor in both the UK and Australia, and also works with many clients in the United States and the Gulf Cooperation Council. He’s worked with companies of all sizes, from the Fortune 500 to small boutique firms. As a financial commentator, Jason has appeared in FT Adviser, Bloomberg, Investors Chronicle, the Daily Mail, the Daily Express, Money Marketing and more. Outside of work, Jason enjoys spending time with his wife and 2 kids, and keeping active. He’s a keen (though slow) endurance athlete, enjoying running, cycling and triathlon.
Subscribe to Newsletter
You May Be Interested In These Other Resources