Working in treasury, accounting, and finance, it’s guaranteed that you and your team are used to working in Excel spreadsheets.
And hey, spreadsheets get the job done, albeit not always in the most efficient way (or effective way for that matter).
The good news is that we’ve identified the top three finance reports that businesses typically manage in Excel.
So, if you’re new to Trovata or are considering moving your cash reporting from Excel to Trovata, this article is for you.

1. Cash Flow by Category/Tag Report
Typically, companies that are manually identifying their transaction activity all follow a similar process. A member of the treasury team will pull transaction activity directly from the bank portal every day or at the end of the week.
From there, they will either categorize each transaction by hand, one-by-one or use a pivot table.
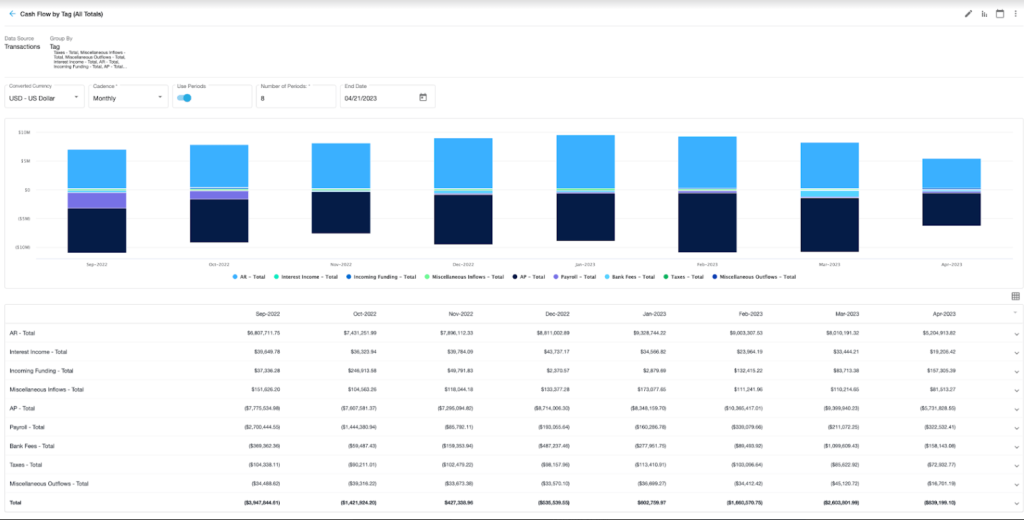
In Trovata, you can simply create a “Cash Flow by Tag” Report. Using the Tags feature, you can create categorization rules that bucket all historical and future transactions into your main cash flow categories.
Here’s an example of a tag structure, where you can categorize tags by:
- Inflows
- Outflows
- ZBAs/Sweeps
- Intercompany

Once you have set up the rules, transaction activity reports will update daily, with no additional manual effort required on your end.
2. Balances by Entity, Region, Division, Account, Institution, or Currency
The larger your company, the more likely it is that you’ll have several entities, regions, and divisions to report on.
Outside of Trovata, a member of the treasury team will typically download the balance activity from the respective bank portal(s) and update their balances spreadsheet manually.
It’s likely that several formulas or tabs are used in Excel to feed all balances from the company’s bank accounts into one summary page that displays total available cash.
In Trovata, data is transmitted via automated API/BAI bank feeds, making it easy to replicate this Balance report, without the need for manual work.
The screenshot below shows a Balances by Region x Entity x Institution report that easily groups Balances into a summary-level view.
The first grouped object is “Region” (i.e. North America, EMEA, etc.), followed by the other layers (Entity & Institution), for a total of 3 group layers:

3. Daily Cash Reconciliation
Finally, outside of Trovata, many treasury teams will build a daily cash activity report in Excel.
Although this report differs from company to company based on the nature of its operations, the core structure remains the same across the board.
This report showcases the Opening balance for the day, followed by the addition or subtraction of cash inflows and outflows, and finally, the Closing balance (+/- any manual adjustments).
Practically speaking, this report helps a treasury team diagnose how much cash they have available and also breaks down their transaction activity on a more granular level.
In Trovata, you can leverage the Reconciliation experience to track opening balances, transaction activity, and closing balance, in a completely automated fashion.
You can avoid manually inputting values and pulling in Excel formulas. Also, leveraging the Tag Breakdown allows an extra level of detail to understand transaction activity.

The Bottom Line
These are just three finance reports that Trovata users can successfully recreate when moving out of Excel, but here are 11 more reports to build in Trovata.
We recommend moving out of spreadsheets and into a tool that automatically taps into your bank data directly, removing the potential for human error and saving hours of work involved with manually aggregating and normalizing your data.


