The essential startup cash forecasting and reporting guide
Finance leaders at growing companies are under pressure to control costs while delivering real growth. That starts with knowing your cash position today and forecasting tomorrow’s as accurately as the business requires, because those two numbers determine how much runway you have. A clear line of sight over cash also means fast answers for the board and investors, and a considered view on when to raise the next round and how much.
Spreadsheets get in the way. The hours of manual work required to maintain them are hours not spent on analysis. The companies that analyze, report on, and forecast cash faster and more accurately outlast their competitors, find growth opportunities hidden in their bank data, and enjoy a lower cost of capital.
This guide explains:
What cash burn is and how to manage it to extend runway
The reporting and forecasting practices that keep a finance leader on top of company health
How to retire the spreadsheets
How open banking APIs and machine learning make reporting and forecasting faster and more accurate
What is cash burn?
A company with cash burn is spending money faster than it earns it. Cash burn is a measure of negative cash flow, the net decrease in cash over time. For a growing company, burn is a tightrope. You want to spend enough to keep growing or to reach the next milestone, and not so much that expenditures consistently outweigh revenue. When they do, the company has a cash-out date, the day it runs out of cash entirely. That date moves with every adjustment you make, whether cutting costs, increasing income, or raising capital.
Cash burn rate is the speed at which reserves are shrinking, usually calculated per month. Cash runway is the amount of time left before the cash is gone. The longer the runway, the more time there is to execute and the more options there are to change the company’s cash situation along the way.
Gross burn rate versus net burn rate
Gross burn rate shows how much the company spends, without regard to what it earns. It gives a clear picture of total spending by removing the bias of a particularly profitable period. A seasonal business gets more use from gross burn rate than a company whose revenue is even across the year.
Net burn rate takes earnings into account. It shows whether the company is losing money even after monthly inflows from revenue-generating activities are added. Most of the time, when people say burn rate, they mean net burn rate. Every business has a gross burn rate because every business spends money. A company has a net burn rate only when cash flow is negative. Runway is calculated from net burn rate.
How to calculate net cash burn rate
Net cash burn rate = (Beginning cash balance minus Ending cash balance) divided by Number of months
First, decide how long a period to evaluate. Burn is expressed per month, but the period should be longer than one month, because one very good or very bad month is misleading. Suppose you choose a four-month period. Using your cash flow statement, find the balance at the start of those four months and the balance at the end. Say it is $200,000 in January and $130,000 at the start of April. Subtract the ending amount from the starting amount. $200,000 minus $130,000 equals $70,000. Divide $70,000 by the four months in the period to get the monthly loss. $70,000 divided by 4 equals $17,500. Your net burn rate is $17,500 per month.
That number gives you runway. Divide the cash you have right now, in this example $130,000 at the start of April, by the net burn rate. $130,000 divided by $17,500 equals 7.42. With revenue and expenses unchanged, the company runs out of money in about seven and a half months.
What is a good cash burn rate?
Ideally there is no net burn and cash flow is positive. Growing a business sometimes means running in the red for a period. Six months to a year of runway is a reasonable range to aim for, leaning toward a year. Like cash flow, burn is a point-in-time metric. A calculation showing seven and a half months of runway is based on current spending and income levels, and reasonable expectations of higher revenue two months out change the picture. Flat or falling revenue expectations mean it is time to cut costs. Suppose the projection shows five months of runway. The next section covers the levers that bring burn back under control.
Five ways to reduce your cash burn rate
Cut costs
Take a hard look at the budget. Recent card statements usually contain at least a few unnecessary or redundant expenses. Part-time remote work and a smaller office lease are common early moves.
Reassess your strategy
Rethink the product mix, go-to-market strategy, and operations to find places to be more cost effective. Products that are expensive to produce or sell are candidates to sunset.
Rethink your loans
Switch to interest-only loans, refinance on more favorable terms, and delay payment as long as possible without incurring fees.
Increase revenue
Revisit pricing. Small price increases add up. Review product and service obligations and confirm pricing matches the value new customers will pay for. Avoid unproven marketing strategies that require a large upfront investment.
Collect payments
Receivables that take too long to arrive do nothing for cash today. Send invoices immediately, and consider incentives for early payment, such as a discount or an additional product.
With burn covered, the next topic is forecasting, which is how you see projected inflows and outflows before they happen.
Why forecast
Forecasting lets you anticipate your future cash position and avoid burning through reserves. Running out of cash is the most common final cause of failure. According to CB Insights’ March 2026 analysis of 431 VC-backed companies that shut down since 2023, 70% ran out of capital, which CB Insights describes as almost always the final cause of death, with the root problem somewhere upstream. The pressure is broader than venture-backed companies. In the Federal Reserve’s 2025 Report on Employer Firms, 51% of small employer firms named uneven cash flows as a financial challenge. Companies that run out of cash overestimated sales, underestimated expenses, or were unprepared for a crisis, and in each case a regular, reasonably accurate cash forecast would have shown the problem earlier.
A good starting practice is a 13-week cash forecast. It confirms there is enough cash on hand to cover operating expenses, prepares you for unexpected scenarios, and shows when surplus cash can be invested for additional return.
What a 13-week cash forecast does
Confirms the company is adequately capitalized
Knowing how much cash is in the bank lets you secure the right financing before the need becomes urgent.
Identifies and plans for cash shortages
Every business has some seasonality. Seeing it alongside typical cash reserves confirms the company can meet working capital needs through the year.
Allocates cash surplus properly
Knowing when a surplus is coming supports better investment decisions and lets capital earn on its own.
Plans for different scenarios
Geopolitical events, a changing economy, growth opportunities, and new market segments all move cash flow in ways the base forecast does not predict. Scenario planning inside the forecast turns those possibilities into cash management plans that can be put into action as they arise.
How to establish a 13-week cash forecast
Determine your forecast’s objectives
A 13-week cash forecast shows what cash the company will have over the period. The requirements depend on company size, strategic objectives, and whether the company is cash rich or cash poor. Understanding the strategic objectives tells you what the forecast has to deliver. Three aspects define the objectives: frequency, level of accuracy, and purpose.
Frequency
A cash-poor company without a large reserve forecasts weekly, and in some cases daily. A cash-rich company forecasts monthly to confirm it is on track for quarterly cash objectives. A big planning date changes the cadence for either. An acquisition, new long-term debt, or an unusually large outflow on a specific day is reason to forecast more often for a while, so the cash is in the right accounts when the outflow hits.
Level of accuracy
Everyone wants the forecast to be as accurate as possible. Near-perfect accuracy costs more time compiling and analyzing data than it returns, and that time comes out of other strategic work. Aim for accuracy that matches how tight cash is. When reserves are low, invest more effort in accuracy to be certain base expenses are covered.
Purpose
A direct cash forecast shows how much cash you have and where it sits at various points in time. Short-term strategic objectives sharpen that purpose. The forecast serves differently when the goal is to accelerate collections, to show the bank enough short-term cash to widen borrowing options, to prepare for a large one-off expenditure such as an acquisition or upfront equipment purchase, or to know where reserves need to be at quarter-end.
The purpose informs the frequency and accuracy the forecast requires, and it shapes cash management strategy. No one understands the business better than you do. Get every key stakeholder to agree on the purpose of the direct cash forecast, so the decisions that follow from it rest on shared assumptions.
Break your cash flow down into inflows and outflows
A 13-week forecast looks simple on paper and grows more complicated as the business grows. Early on, it is easier because the whole business is within reach. As the company adds stakeholders and divisions, some degree of automation becomes necessary to keep the forecast accurate.
Start by understanding the sources of cash and the outflows. In direct cash forecasting, cash is recognized when it enters and leaves the bank accounts, so inflow and outflow categories follow the ways cash travels in and out of the bank.
Sources of cash
Lockbox and deposits: Checks and cash sales
Wire transfers: Wires from outside the organization
ACH deposits: Batch client payments
Borrowing: Short-term loans
FX gains: Exchange rate movements
Cash outflows
Payroll
Accounts payable: Payments to vendors
Wires: Transfers to other bank partners or vendors
Debt payments and debt maturities
FX losses: Losses from a lower exchange rate
These lists are not exhaustive. They are a starting point for mapping the company’s own sources of cash and expenditures.
Different methods for forecasting cash flow
Several statistical methods apply to any forecast period. The most common are naive, simple moving average, and exponential moving average.
Naive forecasting
The naive approach is the least expensive model because it is produced from historical bank data alone. From that data, you assume cash flow will resemble prior periods, which holds best for a company with recurring revenue. Machine learning improves the model by finding trends within the bank data. The weakness is that the method assumes business stays steady over time and does not account for seasonality.
Simple moving average forecasting
A simple moving average (SMA) adds closing cash balances over a period and divides the sum by the number of periods. It reveals whether cash flow is trending up or down over a 30-day or 90-day window. SMA smooths the volatility of cash movement, and it assigns equal weight to every cash position, so a shift in the most recent data is understated.
Exponential moving average forecasting
An exponential moving average (EMA) gives more weight to recent cash positions than SMA does. Many businesses prefer EMA because recent cash activity is usually the better predictor of what comes next.
Trovata’s forecasting model builds the baseline from historical tagged transactions and open invoices, so the treasurer does not have to pick a method by hand.
Keep track of your actuals versus your forecast
Gauging accuracy over time is one of the most important parts of forecasting. Without comparing the ongoing forecast to the baseline produced at the start of the quarter, there is no way to know whether the company is using cash efficiently. Tracking actuals against forecast benchmarks performance over the quarter. The four steps are establish, perform, craft, and communicate.
Establish a baseline forecast
Many companies update the baseline every day with actuals, which leaves nothing to compare the actuals to. Save the initial 13-week forecast at the beginning of the quarter and keep it unchanged, so variance analysis has a fixed reference for the whole period.
Perform variance analysis
For every week of the forecast, measure the difference between actuals and forecast for each inflow and outflow. The analysis shows which factors moved the actuals, and the forecast is adjusted from there.
Craft the story behind the forecast
The numbers are one part of the forecast. Link financial results to business outcomes to show the health of the company.
Communicate the why
Every department affects cash inflows and outflows. Visual, succinct communication to key stakeholders keeps strategic decisions informed by the forecast.
Tips for managing your direct cash forecast
Automate data management to get complete cash and transaction visibility across every bank account
Banking APIs automate the collection, normalization, and analysis of bank data across all accounts. Paired with a cash management platform such as Trovata, the company generates and maintains forecasts and reports from accurate historical bank data without manual work.
Understand operational changes that affect the cash flow model
Markets change, and companies change strategy and processes in response. Historical data only goes so far. One-off events such as acquisitions, share repurchases, and similar decisions cause large swings in outflows that the historical pattern will not predict.
Plan for multiple scenarios
Opportunities and threats appear quickly. The forecast’s job is to identify them as early as possible and set cash management strategies to take advantage of them. With forecast automation, scenario planning gets easier, because the company generates new cash flow forecasts for different investment decisions and sales fluctuations in seconds.
Direct versus indirect cash forecasting
Treasurers focus on when cash moves in and out of bank accounts, and comparing the direct forecast to the indirect forecast is still useful. The indirect forecast recognizes revenue when it is earned. The direct forecast recognizes revenue when cash is received.
The indirect forecast helps a treasurer:
Gain better visibility into AR and AP
Understand the company’s days sales outstanding (DSO) and days payable outstanding (DPO)
Levers you can pull in response to your cash forecast
Accelerate collection of accounts receivable
Know your DSO, which measures the time between closing a sale and receiving the cash from it. When reserves need to rise ahead of a large outflow event, reach out to the clients who reliably pay on time and offer a discount for paying in advance.
Schedule accounts payable against required cash levels
A company that does not forecast the cash required for operating expenses ends up paying AP too early or too late, when that money had better uses elsewhere in the business. Visibility into DPO matters because you do not want to pay bills faster than clients pay you, unless there is a discount for doing so.
Two accounts payable practices that help
Track the efficiency of your DPO
Vendors have different billing terms, commonly net 30, 60, or 90 days. Many offer a discount for payment within 30 days to improve their own DSO, and some do not enforce fees for payment after 60 or 90 days. Knowing each vendor’s billing practices lets you schedule the optimal time to pay outstanding invoices.
Enter invoices into the ERP as they are received
Entering them only as they come due leaves no time to forecast and respond to receivables and payments. Entering them on arrival gives complete visibility into what is coming and lets you adjust cash management strategy in time.
Optimize short-term debt
Knowing how much cash you will need at any given time strengthens your position when borrowing from the bank. Term loans, typically 30-day, 60-day, or 90-day, require at least three days’ notice to the bank. Without clear visibility into operating cash needs, a company falls back on same-day loans at higher rates, which cost more over time. An accurate forecast on hand means borrowing efficiently at the lowest available rate.
Measure the accuracy of your cash forecast with variance reporting
Responding to the forecast is one half. Measuring its effectiveness is the other. Knowing how effective the forecast is requires comparing the active forecast to the baseline saved at the start of the quarter. That is the job of variance reporting, and it is useful in three ways.
It shows how accurate the assumptions are
Compare cash actuals in week two, for example, to what the baseline planned, and calculate the percentage difference. Suppose you find your forecast is 80% accurate by week eight. Knowing that, you dig into cash flow to find the inflows and outflows the forecast did not account for.
It shows which actions produced positive outcomes and how to repeat them
Identifying the differences between baseline and actuals is how you piece together what improves forecast accuracy and which actions have a net positive effect on cash flow.
It builds proactivity into the organization’s processes
Variance reporting builds a culture of data-driven decisions. As part of weekly operations, it adds analysis to cash management and forms a feedback channel between the treasury team and leadership.
Other reports to monitor cash flow
The 13-week forecast is the most important report treasury produces, and several others measure the efficiency and effectiveness of cash management. These are the ones to start with:
Total closing average cash
Share of wallet
Bank accounts per treasury employee
Total closing average cash
Monitoring total closing average cash across global bank accounts shows whether the company is using its cash effectively. With the 3-month Treasury bill at about 4.05% in early October 2026, idle operating balances carry a measurable opportunity cost, and surplus cash is better used paying down debt or earning a return in sound investments.
Breaking the report down shows where the highest and lowest closing balances sit. Break it down by:
Entity
Currency
Share of wallet
Share of wallet is the percentage breakdown of total cash by bank account. It shows where most reserves are held, where cash can be reallocated ahead of a large outflow event, and how to balance the share across institutions to get the most from each bank’s services.
Number of bank accounts per treasury employee
Breaking total bank accounts down per treasury employee shows whether the team is stretched. A small number of treasury employees each managing more than 10 bank accounts have too little time to improve treasury processes. The reverse problem is multiple treasury employees responsible for managing the same bank account, which leads to a potential increase in human error and communication breakdowns.
Increase the efficiency of your cash management through automation
The most valuable thing a finance leader can do is build a direct cash forecast. Used alongside an indirect forecast, it gives a more accurate view of short-term cash and a better forecast of future requirements.
Open banking APIs and machine learning automate the aggregation of raw bank data and support predictive analysis on top of it. A platform such as Trovata shows the team how much cash it has at any moment and builds the forecast from that data.
Gain visibility into your cash flows with Trovata’s open banking APIs
As a company and its bank relationships grow, the volume of cash data increases faster than a spreadsheet can absorb. Many legacy technologies promise to automate the aggregation of bank data and still require manual intervention, which leaves treasury with a visibility gap.
Trovata provides unified access to balance and transaction data from every bank provider through direct API connectivity to hundreds of banks and SWIFT’s network of 11,500+ financial institutions. The data lands in one real-time data foundation, normalized into a single format, so manual data entry disappears and cash reporting and forecasting run automatically. Trovata is backed by a syndicate of some of the largest banks and financial service providers in the world, including J.P. Morgan, Wells Fargo, National Australia Bank, Capital One Ventures, Mastercard, State Street, and PNC.
Retire the spreadsheets with Trovata Cash
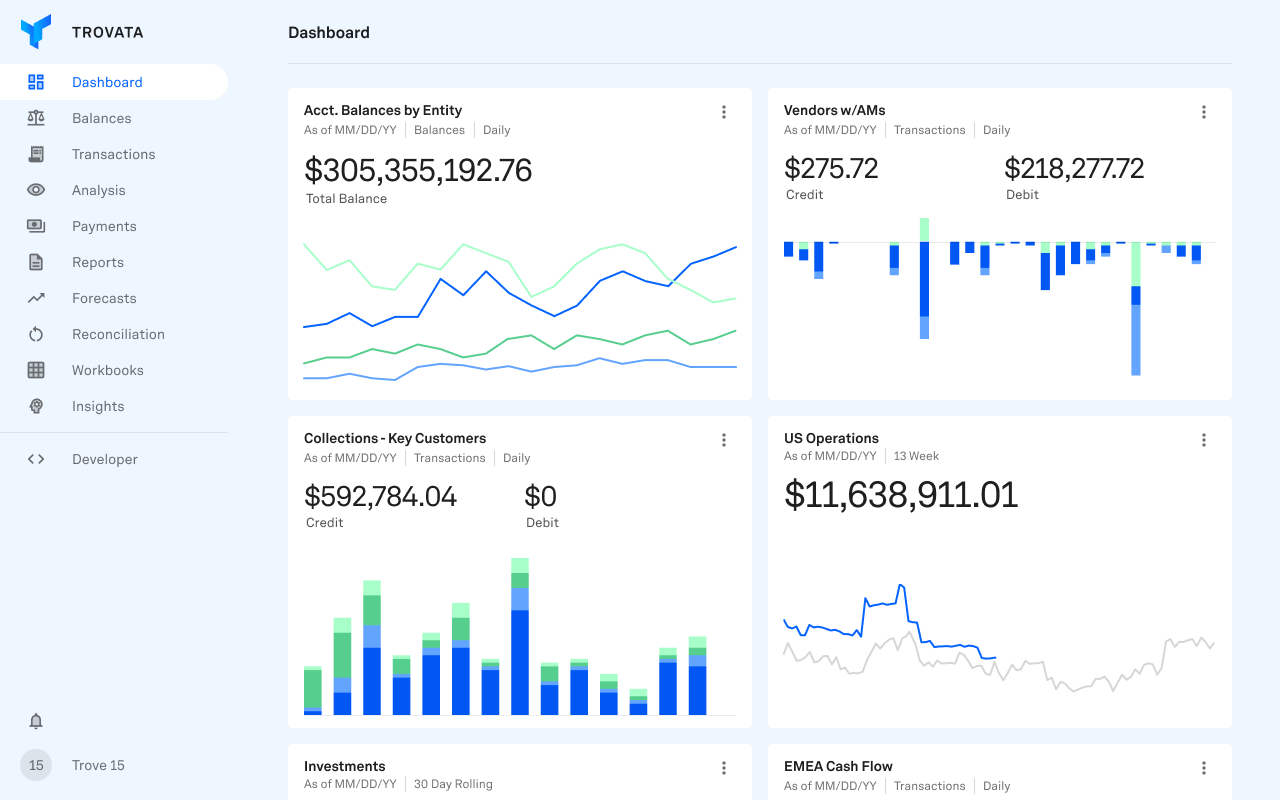
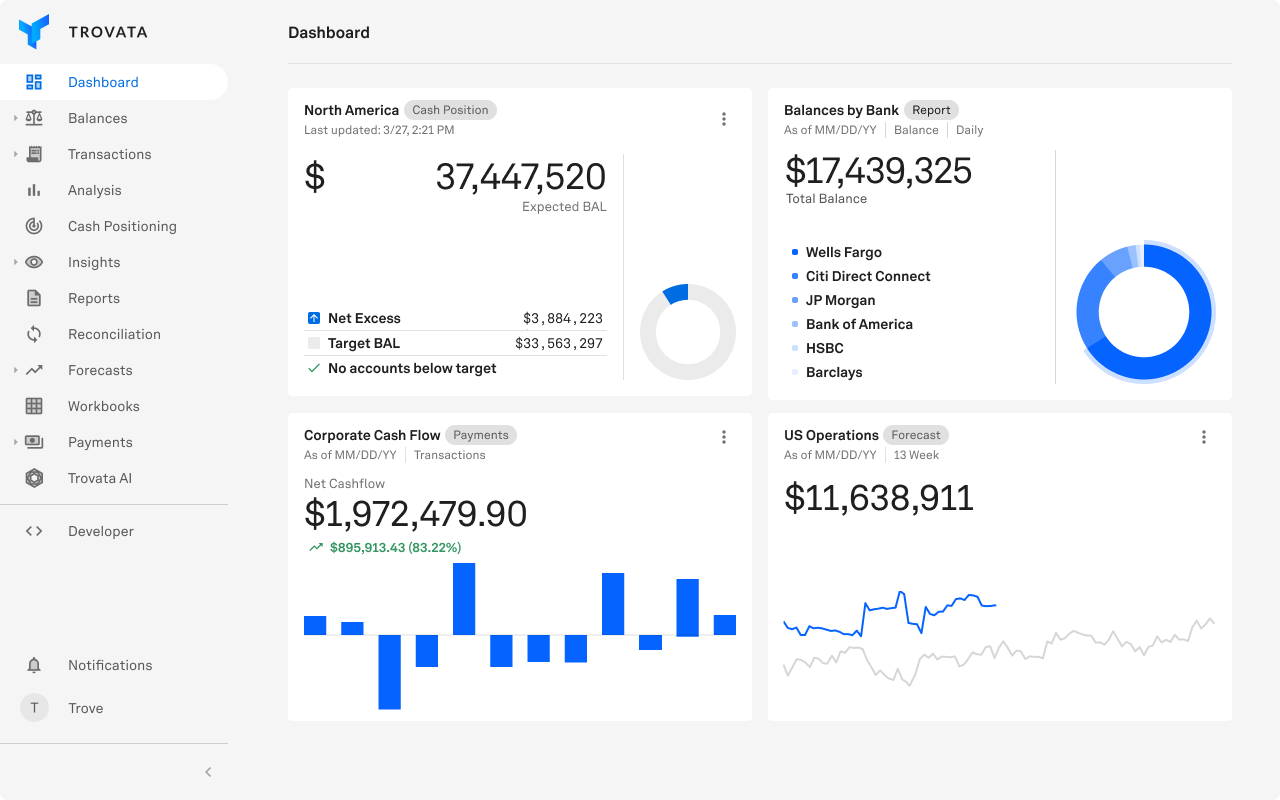
Trovata Cash is up and running in days or weeks, depending on bank connectivity, with no IT support or external consultants. Forecasts build from three stream types. Tag-based streams link to an existing transaction tag and project future values with Trovata’s forecasting model. Open invoice streams use receivable and payable due dates from connected ERPs. Manual entry streams add values the model does not have, such as a planned fundraise or a one-off capital purchase. Growth rates and variables applied to the forecast produce scenarios for different business decisions and potential investments, so the contingency plan exists before the scenario arrives.
Variance reporting is built in. Trovata receives balance data intraday through bank APIs, places actuals against the forecast, and lets the team drill into daily cash flows to see where each variance came from. Eversana used that process to bring its forecast variance down to single-digit percentages and retire its Excel forecast in under four months.
Trovata AI 2.0, released in March 2026, works across the same normalized data with Trovata AI Chat, Trovata AI Insights, and Trovata AI Agents, inside a fully airgapped environment within Trovata’s AWS architecture.
Straightforward implementation, quick onboarding and easy to use. Trovata is extremely intuitive and easy to understand. Building cash reports and cash flows has never been less manual.”

Niall Burke
Global Treasury Manager, Eventbrite
See how managing cash and runway is different with Trovata. Request a demo today.
Subscribe to our newsletter
In this guide
- What is cash burn?
- Five ways to reduce your cash burn rate
- Why forecast
- What a 13-week cash forecast does
- How to establish a 13-week cash forecast
- Break your cash flow down into inflows and outflows
- Different methods for forecasting cash flow
- Keep track of your actuals versus your forecast
- Tips for managing your direct cash forecast
- Direct versus indirect cash forecasting
- Levers you can pull in response to your cash forecast
- Measure the accuracy of your cash forecast with variance reporting
- Other reports to monitor cash flow
- Increase the efficiency of your cash management through automation
- Gain visibility into your cash flows with Trovata’s open banking APIs
- Retire the spreadsheets with Trovata Cash
Subscribe to our newsletter
Other resources



Book Trovata Demo
Watch Recording